Here is the graph:
A place for connecting economic news and theory to the practice of teaching economics
Showing posts with label quantitative easing. Show all posts
Thursday, June 30, 2011
Assessing Quantitative Easing
The Wall Street Journal has a good graphic assessing Quantitative Easing - basically it shows that QE did not accomplish very much in terms of stimulating the economy. I think this is a bit misleading since I do not think that was really the goal of the QE program. Basically, it was to prevent deflation and move investors away from safe haven of government bonds (by lessening the benefits of holding bonds). The argument that a liquidity trap makes monetary policy all but ineffective seems to hold up. So, while QE may not have gotten us out of the hole we are in, it did prevent deflation which would have made things worse - and that is the real measure of its success.
Here is the graph:
Here is the graph:
Saturday, October 30, 2010
Dim expectations for the QE2
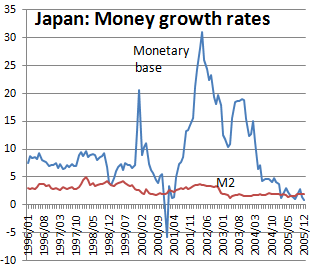
Paul Krugman has been looking at Japan and its lost decade for guide as to what the next round of Fed Quantitative Easing might look like. In a recent blog post he looked at how much effect the Central Bank of Japan's policy of quantitative had on the Japanese money supply. The evidence says it has almost no effect. Here is the graph to support this:
Krugman's explanation for this was that when an economy is up against the zero bound, monetary policy ceases to have any effect. Sounds familiar?
Subscribe to:
Posts (Atom)